

In the frame of the EU project Restore, Reykjavik University is developing the 1st European database of chondral lesions morphometric and associated 3D models, by gathering and processing CT and MRI data from patients suffering from degenerative and traumatic cartilage. This work will serve as benchmark for bio-printing of synthetic cartilage and understand the quantitative and qualitative factors associated to individual patients. The database consists of 24 degenerative (D) cartilage, 15 traumatic (T) and 8 healthy controls (C). It will contain several types of information, including results about cartilage density. The density extracted from the datasets is measured in Hounsfield Unit (HU). The Hounsfield scale is a quantitative scale used for describing radiodensity. The radiodensity of water is 0 HU, the air is -1000 HU, fat around -100 HU, muscle 100 HU, bone from 100-200 to 2000+ HU. The cartilage has been segmented from MRI images, and the bone from the CT. After that, the two datasets are combined through the image registration process. Then, the average cartilage density for each part of the knee (femur, tibia, and patella) has been extracted for each patient. This value can be averaged for each category of patient (degenerative, traumatic, control), to study the behavior the cartilage density and its quality. The density values are displayed on figure 1 for the femoral cartilage, figure 2 for the patellar cartilage, figure 3 for the medial tibia cartilage, and figure 4 for the lateral tibia cartilage.
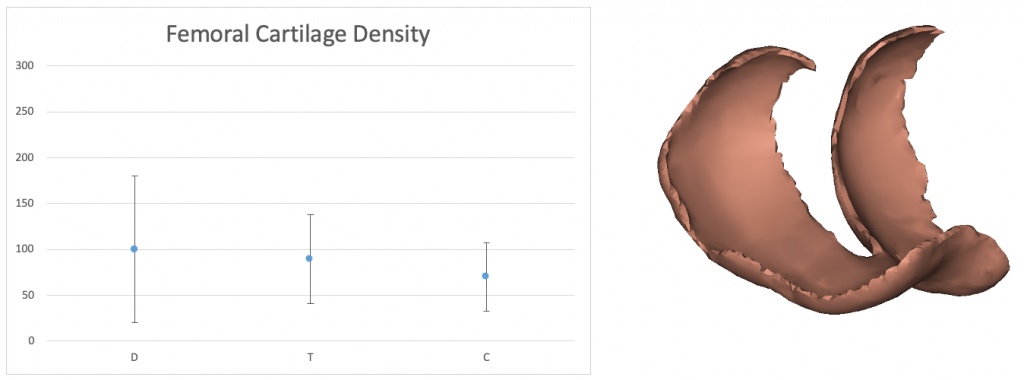
Figure 1 – Femoral density cartilage (in HU) per group
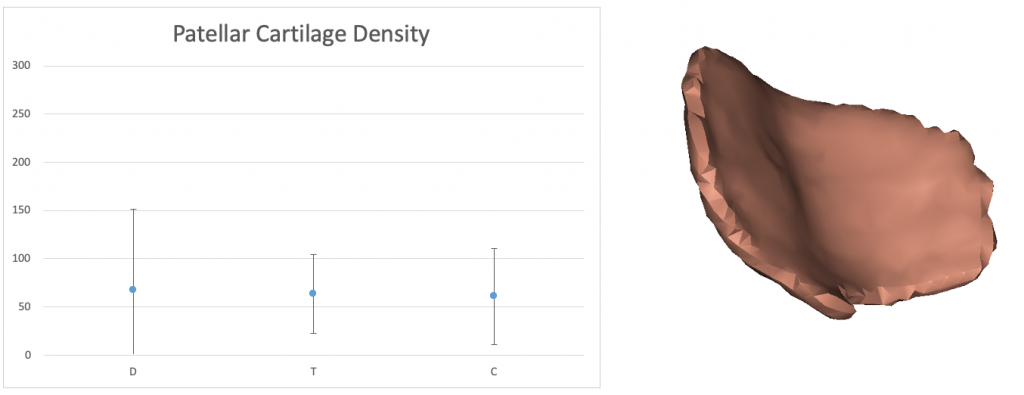
Figure 2 – Patellar cartilage density (in HU) per group
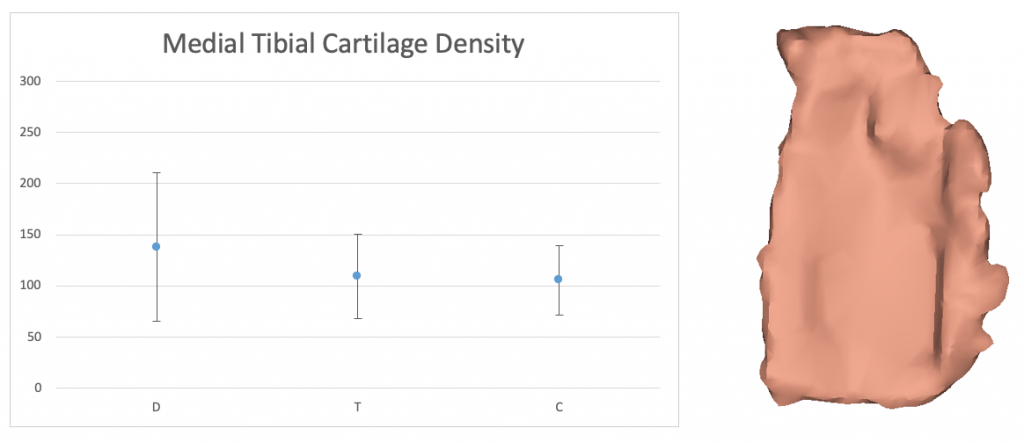
Figure 3 – Medial tibial cartilage density (in HU) per group
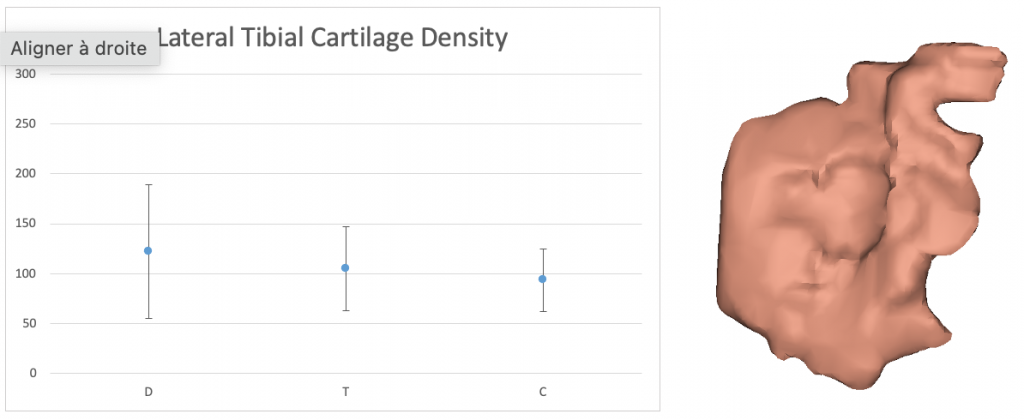
Figure 4 – Lateral tibial cartilage density (in HU) per group
The femoral cartilage reveals a higher value for the D group, around 100 HU, around 90 HU for the T group, where the C group is subsequently lower (around 70 HU). For the patellar cartilage, the D group has the highest value, (around 68 HU), the T group is slightly below 65 HU, where the C group is around 60 HU. The same behaviour is seen on the medial tibial cartilage, with the highest value for the D group (around 138 HU), the T group slightly below 110 HU, and the C group around 105 HU. Finally, the lateral tibial cartilage reveals the highest density for the D group, (around 120 HU), the T group is slightly over 100 HU where the C group is around 95 HU.This preliminary analysis shows that the degenerative cartilage has the highest density for all parts, whereas the control cartilage has the lowest one. It has to be known that the knee cartilage is containing water fluid, which has a density around 0 HU. When the cartilage is aging, or when it start to degenerate due to different conditions such as osteoarthritis for instance, it calcifies little, leading to a drought of the cartilage, so a disappearance of the water it was containing. Therefore, the radiodensity of the cartilage is becoming higher. It explains the fact that the D group is showing the highest density for every cartilage, whereas the C group is having the lowest. The T group is composed of people suffering from an accident, that did not impact necessarily the same part for every subject. Moreover, the age range of this group is younger than for the D group. That is why we can assume that the cartilage is having a lower density than the D group, and a behaviour closer to the C group.